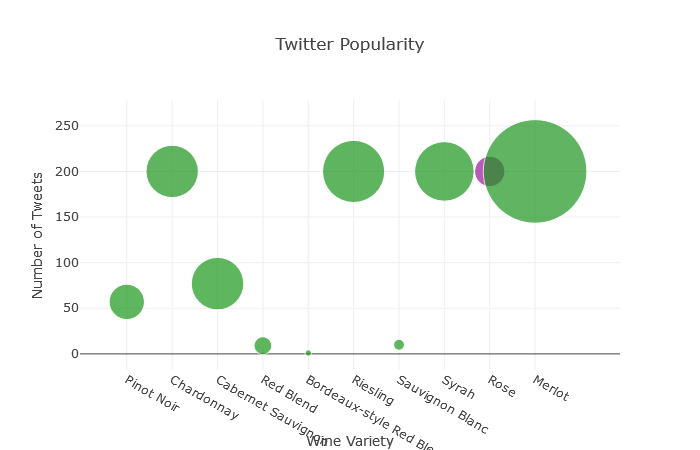
Measuring Twitter popularity of past 30 days
Raw data takes a long time to update and standardize. The busy person who just wants to be in the know is asking "What is everyone saying about this wine? By creating a bubble chart representing the top varieties of wine, we can aid any person in their real time search.
Calculations and Data
This analysis ocurred on April 28th. Four dimensions are represented in thie graph, three of which are quantitative, one of which is qualitative. The qualtiatvie dimension is simply the name of the wine. The three quantitative dimensions are net favorite count, net retweet count, and total tweets. Net favorite count is the sum of all times that all tweets of a wine have been favorites. Net retweet count is calculated identically to net favorite count, with the only difference being that retweets are the calcualated variable. Finally total tweets is just a sum of all tweets of a variety of wine.Analysis
The data given was last updated on April 28th. This means that over the month of April, people have tweeted the most about Rose, Merlot, Riesling, Syrah, and Charodnnay wine. The limitations of the twitter API keep the number of tweets at a maximum of 200 per query. Thus wines that have 200 tweets may be more accurately understood as 200+ tweets. To more accurately reflect the online presence of a wine, one must look at retweet count and favorite count. A larger bubble represents a larger net favorited count. A more purple bubble represent a larger net retweet count. A few interesting conclusions result from the applications of these extra dimensions. First off, a favoirte count does not significantly correlate with a retweet count. The most prominent example is Rose wine, which has over 90000 retweets, but only 69 favorites in the last month. In addition since these are the top ten wines in the database, it is interesting to note that Bordeaux-style Red Blend has only 5 tweets in the past 30 days despite its prevalence in the primary database. Further tools must be applied to raise the cap of gathered tweets from 200 to a more realistic cap.Note: The free version of the twitter API caused most of the limitations in this data set: no more than 200 tweets per query, a limited amount of calls per hour limiting the amount of varieties we can query, and the date limitation of 30 days